(by Mark Dawes, Nov 2018)
At a recent meeting several teachers expressed interest in hearing more about Desmos. Here is an introduction to using the software.
Desmos is graph drawing software (and more, but that’s what we’ll focus on here) that is available via an app (for tablets and phones) or a website.
I still love using GeoGebra, but for other things. Autograph, which for me is the leading graph-drawing software, requires your school to have a licence. Desmos is free for everyone to use, so students can use it at home, trainee teachers can prepare activities without running into licensing issues and teachers can project it or use it in a computer room or with a class set of iPads.
This is a brief overview of the graph drawing part of Desmos and is the first in a series of articles about using ICT in the mathematics classroom.
Finding the program
Go to the website www.desmos.com and click on ‘Start Graphing’.
Getting started
In the panel on the left just type the equation and it will draw it on the graph. You can choose any of the formats shown: starting with “y=”, with x and y on the same side or as a function. (I would prefer it if f(x)= were used to define the function: I think you should need to put y=f(x) to draw it.)
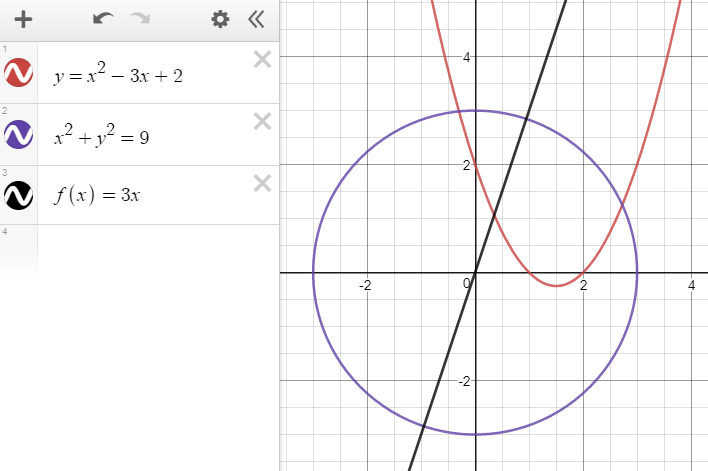
There are several ways to get the squared symbol. Typing shift+6 (the ^ symbol) is the easiest. Clicking on the keyboard symbol in the bottom left corner brings up an onscreen keyboard that includes indices.

Hiding and showing graphs
To the left of the equation there is coloured button (incidentally, this is same colour as the graph, which is a nice touch!). Click this button to hide the graph.
Changing the graph display
On the right of the screen there are buttons to zoom in and out (the mouse scroll wheel also does this) and a spanner icon, which shows various display settings that can be altered.
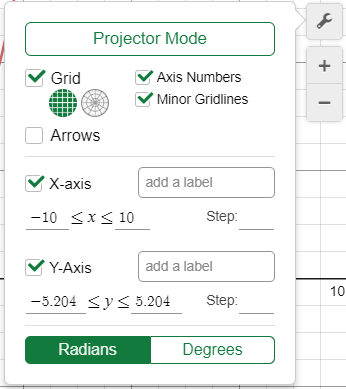
‘Projector Mode’ makes the lines thicker, the numbers on the axes bigger and removes some of the gridlines. You can decide whether you want to show the axes and/or the gridlines, can change to a polar grid, can change the scale on the axes and can add a label to each axis. Putting in a number for ‘Step’ changes the grid as appropriate and also shows multiples of that number on the axis. As well as putting in integers you can put in other things, including pi.
One very useful feature here for A-level teachers is the ease of changing between Radians and Degrees. If you are showing a trig graph in degrees it is very quick to change the x-axis to run from, for example, -410 up to 410.
Dotted lines
The ‘Edit List’ button on the left hand side is worth exploring.

If you click this and then click one of the coloured dots you can change the style of line and the colour.
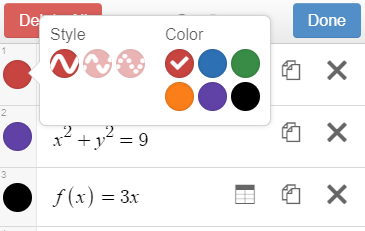
The piece of paper icon creates a duplicate of that graph. This is useful if you want to keep the original and to tweak a copy to make some minor changes.
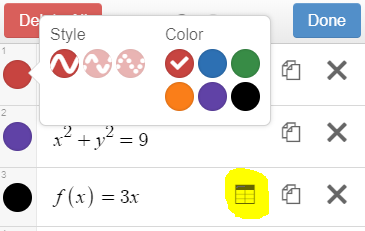
The icon highlighted in the image below creates a table of values with five rows, running from x = -2 to x = 2. If you create a table of values in this way, the line is drawn by default (more info about tables is below).
Adding new content
In the top left there is a plus sign. This allows you to insert new things:
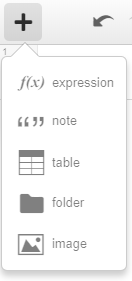
There is no need to use the first of these; pressing enter after entering an equation automatically creates a space for a new expression, as does clicking on the white space after the final expression.
The “note” doesn’t display anything on the graph, so this can be used to write down the equation of a graph before is it copied and pasted as an expression. It also allows for graphs to be labelled and explained.
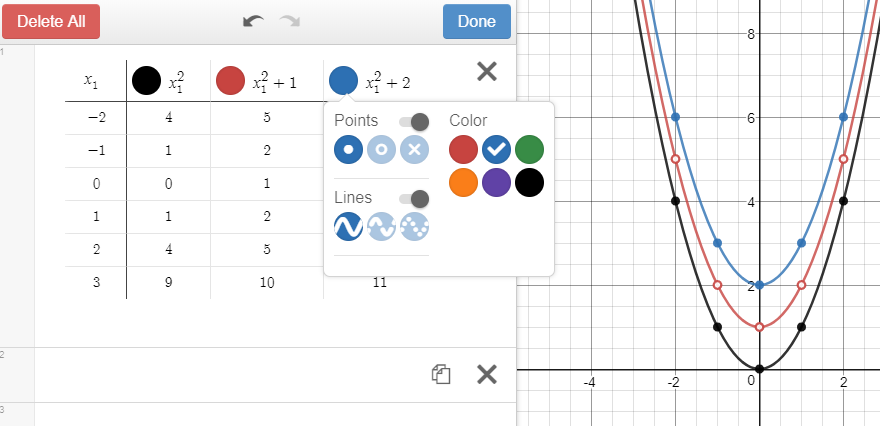
“Table” inserts a new, blank table. Values can be typed here or pasted in. In the first column you enter the x values. After entering the first two values keep pressing enter; Desmos will predict what you want the next values to be. You can type numbers into the second column, or you can write a formula at the top of the column. If the first column is “x1” then this can be changed to x if you wish. Both columns must use exactly the same thing, so if x1 appears in the first column it must also look like that in the second column. (To get the subscript you can type x1.)
More columns can be added by clicking to the right of the table.
Adding a table containing an equation using this method initially just gives the points as individual dots. Clicking on the ‘Edit List’ icon and then clicking on one of the coloured circles allows the line to be turned on.
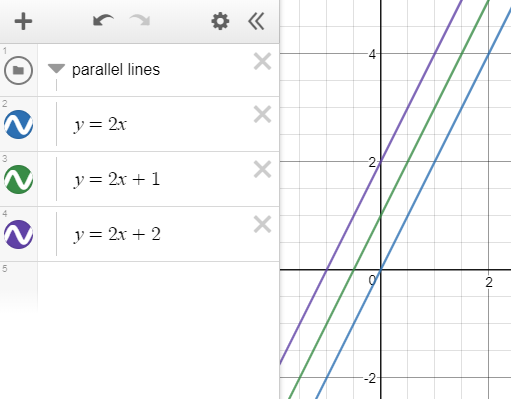
Inserting a “folder” groups together the subsequent equations (shown with a vertical line on the left-hand side). This has two benefits. The equations can be ‘collapsed’ by clicking on the little arrow next to the folder title (which can be edited) and clicking on the folder icon hides all of the lines from the graph.
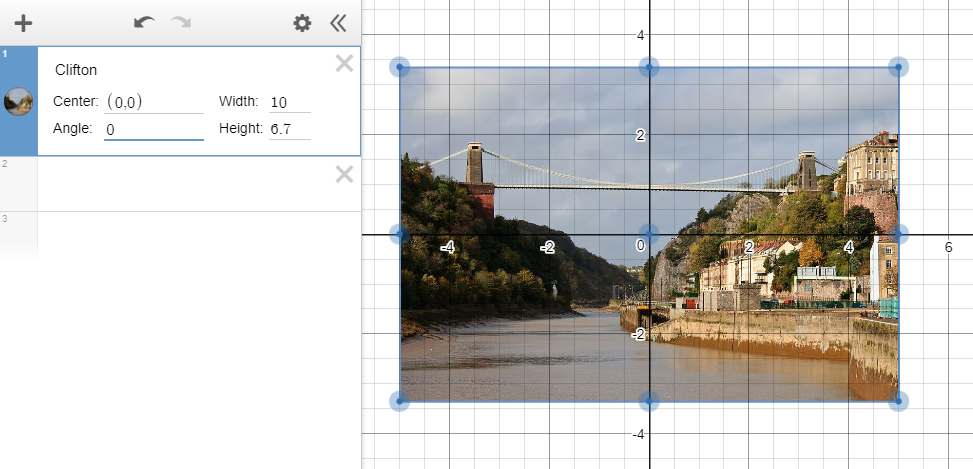
Finally, inserting an “image” allows for any image file to be uploaded from your computer. By default it is placed in the middle of the graph, but it can then be edited either by changing the numbers in the algebra column, or by dragging the hot-spots on the image itself. Beware: the rotation angle uses the same units that appear under the spanner; these are radians by default!
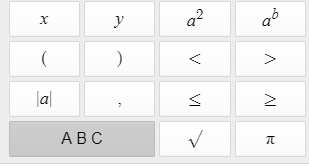
Typing special symbols
There are a few keyboard short-cuts for special mathematical symbols. These include:
Shift+6 to get indices
sqrt creates a square root
If you type <= it becomes ‘less than or equal to’ ( >= is the opposite)
pi changes to the symbol
Trig functions can be typed directly
All of these special symbols are also available via the onscreen keyboard, as is the modulus symbol.
As a quick way to draw graphs it is hard to beat Desmos. It projects well, makes nice-looking graphs that can easily be pasted into PPT or Word if necessary (using Microsoft’s snipping tool) and copes with most of the types of graphs needed for GCSE and A-level mathematics.
Further articles in this series will explore other features of Desmos and ways of using it to teach and learn particular topics.